Graphing Polynomials: Using End Behavior, Leading Coefficient, Zeroes
Hello everyone! For today's video, I will talk about graphing polynomials BUT with a trick. Sometimes, its just very tedious to graph polynomials but in some cases, the general trend of the graph is pretty similar. There are a few things to look out for when given a polynomial.
1.) Even or Odd: tells us the end behavior of the graphs
2.) Positive or Negative Leading Coefficient: tells us the direction of the end behavior
3.) Zeroes: tells us the x-intercepts of the graph
From there, you can pick and choose points to plug into the polynomial and see if the general number is negative or positive. The best scenario is that the polynomial is given to you with the zeroes so you can find the positive and negative sign of the solution, giving you a general idea of what the graph looks like.
Today's focus is to help you Guess the Graph! You don't need to know the exact look of the graph, but with these 3 items, you can pretty much guess the overall look of the graph. There is a "standard" trend for what the graphs look like for each degree of polynomial but there are certain exceptions that don't follow that. I cover a problem for each degree polynomial from x^3 to x^5.
Thanks for watching! Please drop a like and subscribe to my channel. Don’t forget to let me know if you have any questions in the comments below.
For more math videos like this, be sure to subscribe to my channel https://rumble.com/user/CavemanChang
Hope you enjoyed my video! Thanks for watching!
Credits:
Custom Titles: Simple Video Making
Link: https://www.youtube.com/channel/UCOsP...
-
 57:01
57:01
High School Math
3 years agoPolynomial Functions and Graphs
39 -
 15:35
15:35
Leveling Up Math Skills with Basic | Caveman Chang
2 years ago $0.01 earnedGraphing Quadratics In Vertex Form
26 -
 3:37
3:37
Minute Math
2 years agoHow to Evaluate a Polynomial Function for a Given Value | Minute Math
12 -
 11:54
11:54
The Pi Man
1 year ago $0.01 earnedExamples on DEGREE of a Polynomial - What is it and how to get it?
6 -
 15:22
15:22
RobertPrestwidge
3 years agoMath Graphing Set B 01 Cubics in Factorised Form Sketching Intercepts and basic shape
33 -
 5:37
5:37
MathCANBeEasy
2 years ago $0.01 earnedPolynomials Explained: Math CAN Be Easy!!
25 -
 9:30
9:30
Math Easy Solutions
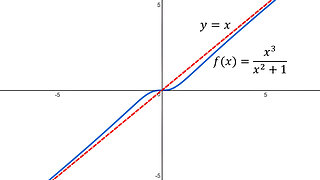
4 months ago $0.03 earnedSlant Asymptote Lines: Example 1: Rational Function
1681 -
![How to Graph a Quadratic Function by Hand [Worked Example] Algebra](https://hugh.cdn.rumble.cloud/s/s8/1/9/M/M/D/9MMDb.0kob-small-How-to-Graph-a-Quadratic-Fu.jpg) 11:25
11:25
Mr. Antonucci Math
3 years agoHow to Graph a Quadratic Function by Hand [Worked Example] Algebra
601 -
 5:15
5:15
Minute Math
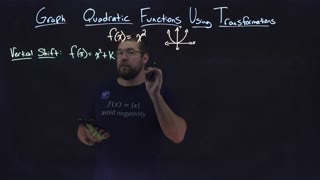
2 years agoHow to graph a vertical shift of a quadratic function | f(x)=x^2+k | Minute Math
26 -
 5:59
5:59
Minute Math
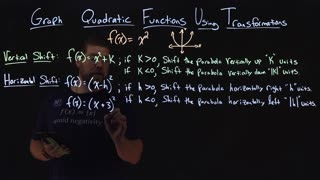
2 years agoHow to graph a horizontal shift of a quadratic function | f(x)=(x-h)^2 | Minute Math
13